Control the quality of steel drum sealing with XR diagram (1)
Control the quality of steel drum sealing with XR diagram (1)
Yang Wenliang
The quality of the steel drum is more reflected in the quality of the sealing of the steel drum, so the quality of the sealing of the steel drum indicates the true quality level of the steel drum. The quality of the sealing of the steel drum is related to many parameters, such as the size of the barrel, the size of the top of the barrel, the size of the top of the barrel, etc. These process sizes have been finalized, if they are effectively controlled, The quality of steel drum sealing can not be effectively controlled, the reason is more complicated.
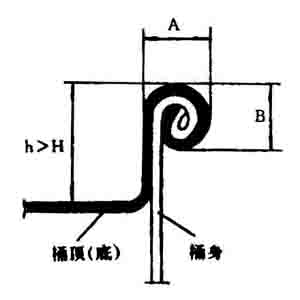
Through long-term production practice, the author finds that the fluctuation of the quality of the steel drum seal is closely related to the three dimensions of the bottom depth, the curl width and the curl thickness of the steel drum seal (as shown in Figure 1).

A-curtain thickness; B-curl width; H-bar top (bottom) depth
Figure 1 Schematic diagram of steel drum sealing
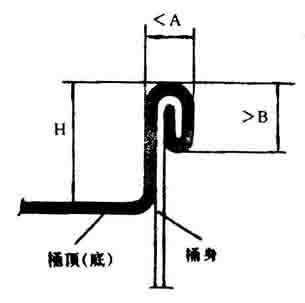
1. The top depth of the barrel bottom. The greater the depth of the bottom of the barrel, it indicates that during the winding process, the sealing disk stretches the top of the bottom of the barrel. This will make the width of the top of the original normal bottom of the bucket smaller, and the width of the edge that is wound into the curling edge will be less. It is obvious that the curling is not tight and the winding layer is insufficient (as shown in Figure 2). .
A-curtain thickness; B-curl width; h-bar top (bottom) depth
Figure 2 The top of the bucket (bottom) is too deep
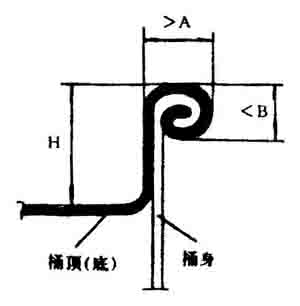
2, the width of the curling. The larger the curling width, the looser the structure inside the curling edge, and the number of crimping layers is not achieved when making the round curling edge. The development limit is five-layer rectangular crimping (as shown in Fig. 3). If the curl width is too small, the roll structure will also be unreasonable and not compact. When the steel drum falls, the curling may easily loosen the steel drum leakage (as shown in Figure 4).
A-curtain thickness; B-curl width; H-bar top (bottom) depth
Figure 3 The curling width is too large
A-curtain thickness; B-curl width; H – bucket top (bottom) depth
Figure 4 The curling width is too small
3. Curling thickness. The crimp thickness and the curl width are two dimensions that complement each other. When the material and process size of the steel drum are fixed, the larger the curling thickness, the smaller the curling width; the smaller the curling thickness, the larger the curling width. Only in this way can we ensure that the curling layer is not loose and seamless. If the curl width and thickness are simultaneously reduced, the curling roller groove is also reduced accordingly. In this way, the material will be redundant in the wheel groove; it may not be installed, and the iron tongue may be generated, the depth of the bottom of the barrel is increased, and the sealing is broken; if the width and thickness of the curling edge are simultaneously increased, the roller groove is also required to be wound. Increase accordingly. In this way, the material is small and the wheel groove is large, which may cause problems such as looseness of the curling.
Under normal circumstances, the top depth of the bottom of the bucket, the width of the bead and the thickness of the bead should be controlled within an optimal range. Only in this way can the product quality be effectively guaranteed.
So how should these three parameters be controlled? In actual production, the situation is quite complicated. The three parameters do not affect each other. Their changes are also affected by various aspects, including the shape and size of the roller groove of the crimping machine; the shape of the crimping machine. Dimensions; pressure of the seal; adjustment of the crimping roller of the crimping machine, various related process sizes and raw materials, etc. Changes in the three parameters are sometimes unconscious, and it is difficult to find out when the problem occurred and the nature of the problem.
In order to find out the time and root cause of the problem and solve the quality problem in time and accurately, we use the quality control control chart method to control the quality of the steel drum sealing and received good results.
First, the principle of process quality control using control charts
The control chart is a graph with control limits that are used to analyze and determine whether the process is in a controlled state. It graphically displays the quality fluctuations of the production process over time, and analyzes and judges whether it is due to accidents, causes, or quality fluctuations due to system reasons, thus reminding people to make correct countermeasures in time to eliminate systemic causes. A statistical method that dynamically controls the process while keeping the process in a stable state.
When the production conditions are normal and the production process is in a state of control (the production process only has an accidental effect), the distribution of the quality characteristics of the product generally follows the normal distribution law. It can be known from the nature of the normal distribution that the probability that the quality index falls within the range of 3δ is about 99.7%, and the probability of falling outside the ±3δ is only 0.3%, which is a small probability. According to the principle of small probability events, a small probability event that exceeds the range of ±3δ in a sell-out is almost impossible. If this happens, the process is unstable. In other words, there must be a systematic cause in the production process. At this time, we remind us to trace the cause and take measures to restore the process to a stable (controlled) state.
Using the control chart to determine whether the process is stable is actually a method of statistical inference. The control map control limits determined by the 3δ method are generally considered to be the most economical and reasonable method. Therefore, we have adopted this method according to the characteristics of our own industry. Figure 5 is a basic form of the control chart. The ordinate is the quality characteristic value, and the abscissa is the sampling time or the sample number. There are three lines on the map: the upper one is called the control limit line (referred to as the upper control line), and is represented by the symbol UCL; the middle solid line is called the center line and is represented by the symbol CL; the next dotted line is called the lower limit line (referred to as the lower limit line) Control line), denoted by the symbol LCL. These three lines are calculated by collecting data from a period of time in production steady state. In use, the samples are periodically extracted, and the measured quality characteristic data is plotted on the map one by one. It is judged whether the production process is in a normal control state according to whether the point exceeds the arrangement of the upper and lower control lines and the points.
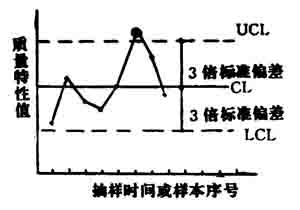
Figure 5 Basic form of the control chart
Stand Lcd Digital Signage Solutions
LCD digital signage with stable stand, has a wide range of digital information and communication products used in all industries from retail like shopping malls, banks, public institutions, hotels, galleries, museums and so on.
Meanwhile customized idea is available for us, we are able to offer you the most interactive display.
Advertising Player,Stand Floor Digital Signage,Standing Digital Signage,Stand Lcd Digital Signage
Guangzhou Sosu Electronic Technology Co., Ltd. , http://www.sosuchina.com